
Mathematics for IGCSE & O level - Statistical Diagrams (Section 2 - No. 38)
Based on the bar chart, in which week was the difference between computer and printer sales the greatest? 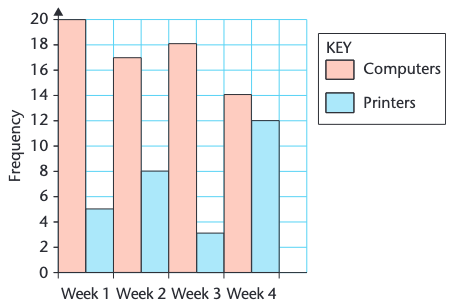
Week 1
Week 2
Week 3
Week 4
Wyjaśnienie
The difference between the blue and the red bar.